As a niche market in the special vehicle industry, recreational vehicle (RV) has been developed in China for nearly 20 years, and has been highly valued by the country and the industry.
According to the registration data provided by the China Automobile Dealers Association, the actual sales of RVs in China in December 2022 were 1,009 units, a year-on-year decrease of 10%; the cumulative sales of RVs in 2022 were 11,391 units, a year-on-year decrease of 9%.
| |
Jan |
Feb |
Mar |
Apr |
May |
Jun |
Jul |
Aug |
Sep |
Oct |
Nov |
Dec |
| Sales in 2022 |
1276 |
380 |
769 |
569 |
843 |
1318 |
1171 |
1292 |
1158 |
787 |
819 |
1009 |
| Sales in 2021 |
935 |
411 |
720 |
1266 |
1013 |
1487 |
1429 |
937 |
1302 |
962 |
1003 |
1117 |
| YOY growth |
36.5 |
-7.5 |
6.8 |
-55.1 |
-16.8 |
-11.4 |
-18 |
-38 |
-11 |
-18 |
-18 |
-9 |
Sales volume and year-on-year growth statistics of the RV market in December and January-December in recent years
| |
2018 |
2019 |
2020 |
2021 |
2022 |
| Sales in Dec |
602 |
799 |
966 |
1117 |
1009 |
| YOY growth in Dec |
17 |
33 |
21 |
16 |
-10 |
| Sales of whole year |
7374 |
9177 |
8787 |
12582 |
11391 |
| YOY growth |
62 |
24 |
-4 |
43 |
-3 |
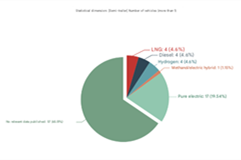
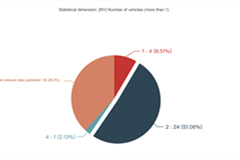
Sales volume and proportion of various RVs in December and the whole year of 2022
| |
C-type RV |
B-type RV |
A-type RV |
Total |
| Sales in Dec |
674 |
319 |
16 |
1009 |
| Proportion of Dec |
66.8 |
31.6 |
1.6 |
100 |
| Sales in 2022 |
7871 |
3426 |
94 |
11391 |
| Proportion of 2022 |
69.1 |
30.08 |
0.82 |
100 |
According to the terminal registration data, the top 10 sales volume of RV companies in 2022
| Rank |
Company |
Sales in 2022 |
Sales in 2021 |
YOY growth in 2022 |
Market share in 2022 |
| 1 |
SAIC MAXUS |
1605 |
1417 |
13.3 |
14.09 |
| 2 |
Yutong |
1104 |
1311 |
-15.8 |
9.69 |
| 3 |
Zhejiang Daide Longcui |
611 |
653 |
-6.4 |
5.36 |
| 4 |
Hubei Heli |
563 |
705 |
-20.1 |
4.94 |
| 5 |
Hebei Lanzhong |
545 |
499 |
9.2 |
4.78 |
| 6 |
Jiangsu Weihang |
418 |
538 |
-22.3 |
3.67 |
| 7 |
Chery |
415 |
446 |
-7 |
3.64 |
| 8 |
Hubei Qixing |
406 |
248 |
63.7 |
3.56 |
| 9 |
Hubei Chengli |
282 |
669 |
-57.8 |
2.48 |
| 10 |
Henan Xinfei |
224 |
342 |
-34.5 |
1.97 |
| |
Industry |
11391 |
12582 |
-9.4 |
100 |
Top 10 regions of RV sales in 2022
| Rank |
Regional market |
Sales in 2022 |
Proportion of 2022 |
| 1 |
Jiangsu |
1960 |
17.21 |
| 2 |
Shandong |
1161 |
10.19 |
| 3 |
Hubei |
937 |
8.23 |
| 4 |
Zhejiang |
922 |
8.09 |
| 5 |
Guangdong |
688 |
6.04 |
| 6 |
Henan |
677 |
5.94 |
| 7 |
Liaoning |
540 |
4.74 |
| 8 |
Sichuan |
506 |
4.44 |
| 9 |
Beijing |
426 |
3.74 |
| 10 |
Hebei |
404 |
3.55 |
| |
Top 10 |
8221 |
72.17 |
| |
Total |
11391 |
100 |
Source : www.chinaspv.com
Editor : Grace
Views:3635
 According to the registration data provided by the China Automobile Dealers Association, the actual sales of RVs in China in December 2022 were 1,009 units, a year-on-year decrease of 10%; the cumulative sales of RVs in 2022 were 11,391 units, a year-on-year decrease of 9%.