New energy refrigerated vehicles sales increased by 70% YOY in 2022
February 13,2023
Refrigerated vehicles are a niche market segment among special-purpose vehicles, mainly used for delivery of fruits and vegetables, medicine, fresh food, etc. With the rapid development of cold chain logistics and the support of many favorable policies at the national and local levels, the refrigerated transport vehicle market has developed rapidly. Among them, the performance of new energy refrigerated trucks is more prominent, but the epidemic in 2022 also had a certain impact on its sales.
 According to the terminal registration information, the cumulative sales of new energy refrigerated vehicles in 2022 was 2,915, an increase of nearly 70% compared with 1,736 in 2021.
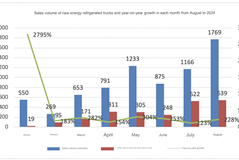
Sales of new energy refrigerated vehicles and year-on-year statistics from January to December 2022:
Top 7 companies of new energy refrigerated vehicles in 2022:
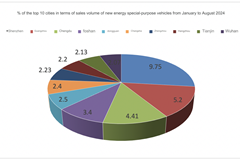
The sales statistics of new energy refrigerated vehicles in cities with more than 100 vehicles in 2022 are as follows:
Sales of new energy refrigerated vehicles and year-on-year statistics from January to December 2022:
| Jan | Feb | Mar | Apr | May | Jun | Jul | Aug | Sep | Oct | Nov | Dec | Whole year | |
| Sales in 2022 | 86 | 52 | 157 | 178 | 157 | 266 | 346 | 256 | 262 | 145 | 340 | 670 | 2915 |
| Sales in 2021 | 99 | 18 | 95 | 128 | 93 | 138 | 145 | 235 | 165 | 170 | 181 | 269 | 1736 |
| YOY growth | -13.1 | 188.9 | 65.3 | 39.1 | 68.8 | 92.8 | 138.6 | 9 | 58.8 | -14.7 | 87.8 | 149.1 | 68 |
| Rank | Company | Sales in 2022 | Sales in 2021 | Market share in 2022 |
| 1 | Geely New Energy | 512 | 621 | 17.56 |
| 2 | Guangxi Auto | 478 | 175 | 16.4 |
| 3 | Beiqi Foton | 334 | 8 | 11.46 |
| 4 | Chongqing Ruichi | 279 | 294 | 9.57 |
| 5 | SAIC Maxus |
233 | 61 | 7.99 |
| 6 | Dongfeng Motor | 159 | 88 | 5.45 |
| 6 | Yutong | 159 | 12 | 5.45 |
| Top 5 total | 2154 | 1259 | 73.9 |
| Rank | City | Sales in 2022 | Market share% |
| 1 | Chengdu | 401 | 13.76 |
| 2 | Beijing | 301 | 10.33 |
| 3 | Chongqing | 224 | 7.68 |
| 4 | Shenzhen | 191 | 6.55 |
| 5 | Jiaxing | 148 | 5.08 |
| 6 | Zhengzhou | 146 | 5.01 |
| 7 | Wuhan | 109 | 3.74 |
| Top 7 total | 1520 | 52.2 | |
| Total | 2915 | 100 |
Source : www.chinaspv.com
Editor : Alice
Views:3436
Share :


Poster

Press to save or share