China recreational vehicles sales decreased by 18% YOY in November 2022
January 12,2023
Recreational vehicles (RV) , as a niche market in the special vehicle industry, has been developing in China for nearly 20 years, and has been highly valued by the country.
In recent years, the RV market has developed rapidly. However, due to the impact of the epidemic, the growth rate of China's RVs has slowed down after the rapid growth in 2021.
According to the registration data provided by the China Automobile Dealers Association, the actual sales of RVs in China in November 2022 was 819 units, an increase of 4% from the 787 units in October, but a decrease of 18% from the 1,003 units in November 2021. A total of 10,382 units RVs were sold, a year-on-year decrease of 9%, which is mainly due to the impact of the recent epidemic.
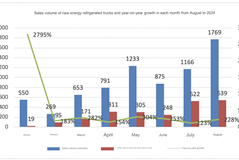
Year-on-year and month-on-month statistics of RV sales in each month from January to November 2022
In recent years, the RV market has developed rapidly. However, due to the impact of the epidemic, the growth rate of China's RVs has slowed down after the rapid growth in 2021.
According to the registration data provided by the China Automobile Dealers Association, the actual sales of RVs in China in November 2022 was 819 units, an increase of 4% from the 787 units in October, but a decrease of 18% from the 1,003 units in November 2021. A total of 10,382 units RVs were sold, a year-on-year decrease of 9%, which is mainly due to the impact of the recent epidemic.
Year-on-year and month-on-month statistics of RV sales in each month from January to November 2022
| Jan | Feb | Mar | Apr | May | Jun | Jul | Aug | Sep | Oct | Nov | |
| Monthly sales in 2022 | 1276 | 380 | 769 | 569 | 843 | 1318 | 1171 | 1292 | 1158 | 787 | 819 |
| Monthly sales in 2021 | 935 | 411 | 720 | 1266 | 1013 | 1487 | 1429 | 937 | 1302 | 962 | 1003 |
| YOY growth | 36.5 | -7.5 | 6.8 | -55.1 | -16.8 | -11.4 | -18 | 38 | -11 | -18 | -18 |
The sales volume of RVs in November was 819 units, ranking seventh in the monthly sales volume from January to November in 2022, with a year-on-year decrease of 18%. According to analysis, the main reasons are:
First, the epidemic situation got serious in November 2022, and "silence" or control appeared in many places, which affected the tourism market.
The second is that the PMI value of China's manufacturing industry in November 2022 was only 48%, and the market "prosperity" is one of the worst months in the second half of 2022.
According to the data of China Automobile Dealers Association, the sales volume and year-on-year statistics of RV in November and January-November 2022:
| 2018 | 2019 | 2020 | 2021 | 2022 | |
| Sales in Nov | 561 | 641 | 745 | 1003 | 819 |
| YOY growth in Nov | 30 | 14 | 16 | 35 | -18 |
| Sales from Jan to Nov | 6772 | 8378 | 7821 | 11465 | 10382 |
| YOY growth from Jan to Nov | 68 | 24 | -7 | 47 | -9 |
Sales volume and proportion of various RVs in November and January-November 2022
| C-type RV | B-type RV | A-type RV | Total | |
| Sales in Nov | 537 | 270 | 12 | 819 |
| Proportion of Nov | 65.6 | 33 | 1.4 | 100 |
| Sales from Jan to Nov | 7197 | 3107 | 78 | 10382 |
| Proportion from Jan to Nov | 69.3 | 29.9 | 0.8 | 100 |
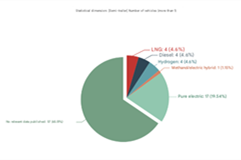
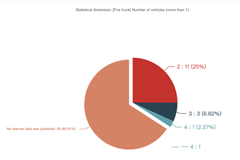
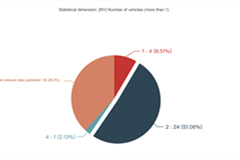
According to the terminal registration data, according to the length segment, the sales structure statistics of the RV market in November 2022 and January-November:
| Under 6m | 6-8m | Over 8m | Total | |
| Sales in Nov | 749 | 58 | 12 | 819 |
| Proportion of Nov | 91.5 | 7.1 | 1.4 | 100 |
| Sales from Jan to Nov | 10172 | 132 | 78 | 10382 |
| Proportion from Jan to Nov | 97.98 | 1.27 | 0.75 | 100 |
It can be seen from the above chart that whether it is November 2022 or January-November, models with a length below 6 meters account for more than 90%, and occupy the absolute main body of the RV market. It shows that the main demand in the current RV market is the model with a length below 6 meters. According to research and analysis, the main reason is that models below 6 meters can achieve better driving safety and driver’s license versatility. At the same time, the cost of using small RVs is relatively low, and they are more suitable for family travel.
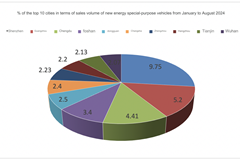
According to the terminal registration data, the sales ranking of RV companies in November and January-November 2022 (excluding chassis):
According to the terminal registration data, the sales ranking of RV companies in November and January-November 2022 (excluding chassis):
| Rank in Nov | Company | Sales in Nov | YOY growth in Nov | Sales from Jan to Nov | Rank from Jan to Nov |
| 1 | SAIC Maxus | 257 | -34 | 3525 | 1 |
| 2 | Nanjing Auto | 228 | -28 | 3319 | 2 |
| 3 | JMC | 134 | 6 | 1546 | 3 |
| 4 | Baiqi Foton | 39 | 105 | 275 | 5 |
| 5 | Great Wall | 25 | -50 | 481 | 4 |
| 6 | Jiangxi Isuzu | 25 | 150 | 157 | 8 |
| 7 | Sinotruk Ji’nan Commercial Vehicle | 21 | 320 | 147 | 9 |
| 8 | Qingling | 17 | 467 | 158 | 7 |
| 9 | Hyundai Auto | 12 | Net growth | 58 | 12 |
| 10 | Zhengzhou Richan | 11 | 22 | 74 | 11 |
| Total | 819 | -18 | 10382 |
Source : www.chinaspv.com
Editor : Mark
Views:3427
Share :


Poster

Press to save or share