Electric sanitation vehicles sales increased by 23.5% YOY in Sep in China
November 14,2022
With the continuous development of the dual-carbon strategy, the market of new energy sanitation vehicles has also shown a good momentum of development, and the market of pure electric sanitation vehicles is more prominent.
 Terminal licensing data shows that in September 2022, 441 units electric sanitation vehicles were sold, a year-on-year increase of 23.5%; from January to September 2022, a total of 3,172 units electric sanitation vehicles were sold, a year-on-year increase of 50.1%.
According to the terminal licensing data, the sales volume and year-on-year comparison of electric sanitation vehicles and sanitation vehicles in September and January-September 2022:
Whether in September or from January to September, the year-on-year growth of electric sanitation vehicles far outperformed the broader market of sanitation vehicles. According to the analysis, the main reasons are:
First, local cities are currently implementing the environmental protection benefit assessment system. And thus municipal sanitation departments actively purchased electric sanitation vehicles to achieve environmental protection benefits.
Second, the continuous promotion of the "dual carbon" strategy and the introduction of various preferential policies to encourage the development of new energy vehicles have stimulated the growth of the electric sanitation vehicle market.
Third, the sales base of electric sanitation vehicles last year was relatively low, which boosted the growth of the electric sanitation vehicle market in September and from January to September this year.
Monthly sales and year-on-year sales of electric sanitation vehicles from January to September 2022:
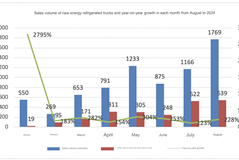
The sales of electric sanitation vehicles in each month from January to September this year showed a positive year-on-year growth, demonstrating a good development trend of "nine consecutive increases". Among them, the largest year-on-year increase was in June, reaching 118%, and the highest sales volume was 544 units in August.
According to the terminal licensing data, the market penetration statistics of electric sanitation vehicles in September and January-September this year:
Whether in September or from January to September this year, the market penetration rate of electric sanitation vehicles has increased significantly year-on-year, which shows that the electrification process of the sanitation vehicle market is accelerating.
According to the terminal licensing information, the sales and year-on-year growth of electric sanitation vehicles in the first three quarters of this year divided by tonnage are as follows:
According to the above data analysis, in the first three quarters of this year, medium-sized vehicles dominated the electric sanitation vehicle market, while light-weight vehicles witnessed increase. The reason why light-duty sanitation vehicles can lead the market of electric sanitation vehicles is mainly due to the accelerated urbanization process in China. The increase of some small and medium-sized cities had more demands for light-duty sanitation vehicles.
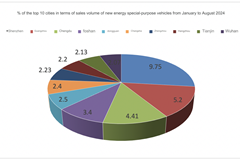
According to the terminal licensing information, the sales volume of electric sanitation vehicles in the TOP10 regions from January to September and September 2022 and the year-on-year ratio:
According to the terminal incensing information, market share ranking of major brands of electric sanitation vehicles from January to September and September 2022 are as follows:
According to the terminal licensing data, the sales volume and year-on-year comparison of electric sanitation vehicles and sanitation vehicles in September and January-September 2022:
| Electric sanitation vehicle | Sanitation vehicle | |
| Sales in Sep 2022 | 441 | 5495 |
| Sales in Sep 2021 | 357 | 6345 |
| YOY growth in Sep | 23.5 | -13.4 |
| Sales from Jan to Sep 2022 | 3172 | 55539 |
| Sales from Jan to Sep 2021 | 2114 | 65034 |
| YOY growth from Jan to Sep | 50.1 | -14.6 |
Whether in September or from January to September, the year-on-year growth of electric sanitation vehicles far outperformed the broader market of sanitation vehicles. According to the analysis, the main reasons are:
First, local cities are currently implementing the environmental protection benefit assessment system. And thus municipal sanitation departments actively purchased electric sanitation vehicles to achieve environmental protection benefits.
Second, the continuous promotion of the "dual carbon" strategy and the introduction of various preferential policies to encourage the development of new energy vehicles have stimulated the growth of the electric sanitation vehicle market.
Third, the sales base of electric sanitation vehicles last year was relatively low, which boosted the growth of the electric sanitation vehicle market in September and from January to September this year.
Monthly sales and year-on-year sales of electric sanitation vehicles from January to September 2022:
| Jan | Feb | Mar | Apr | May | Jun | Jul | Aug | Sep | Jan to Sep | |
| Monthly sales in 2022 | 379 | 195 | 361 | 236 | 292 | 375 | 349 | 544 | 441 | 3172 |
| Monthly sales in 2021 | 236 | 144 | 237 | 135 | 193 | 172 | 328 | 302 | 357 | 2114 |
| YOY growth | 60.6 | 35.4 | 52.3 | 74.8 | 51.3 | 118.0 | 6.4 | 80.1 | 23.5 | 50.1 |
The sales of electric sanitation vehicles in each month from January to September this year showed a positive year-on-year growth, demonstrating a good development trend of "nine consecutive increases". Among them, the largest year-on-year increase was in June, reaching 118%, and the highest sales volume was 544 units in August.
According to the terminal licensing data, the market penetration statistics of electric sanitation vehicles in September and January-September this year:
| Electric sanitation vehicle sales | Total sanitation vehicle sales | Proportion of electric sanitation vehicle | |
| Sep 2022 | 411 | 5495 | 7.5 |
| Sep 2021 | 357 | 6345 | 5.6 |
| Jan to Sep 2022 | 3172 | 55539 | 5.7 |
| Jan to Sep 2021 | 2114 | 65034 | 3.25 |
According to the terminal licensing information, the sales and year-on-year growth of electric sanitation vehicles in the first three quarters of this year divided by tonnage are as follows:
| Less than 6t (light-duty) | 6-14t (medium-size) | 14-18t (heavy-duty) | Total | |
| Sales from Jan to Sep 2022 | 682 | 1754 | 736 | 3172 |
| Sales from Jan to Sep 2021 | 328 | 1184 | 602 | 2114 |
| YOY growth from Jan to Sep | 107.9 | 48.1 | 22.3 | 50.1 |
| Proportion from Jan to Sep 2022 | 21.5 | 55.3 | 23.2 | 100 |
| Proportion from Jan to Sep 2021 | 15.5 | 56.0 | 28.5 | 100 |
According to the terminal licensing information, the sales volume of electric sanitation vehicles in the TOP10 regions from January to September and September 2022 and the year-on-year ratio:
| Rank from Jan to Sep | Region | Sales from Jan to Sep | Sales in Sep | YOY growth in Sep |
| 1 | Guangdong | 918 | 106 | -18.4 |
| 2 | Sichuan | 538 | 26 | 21.7 |
| 3 | Hubei | 333 | 71 | 271.7 |
| 4 | Jiangsu | 315 | 97 | 203.1 |
| 5 | Hunan | 230 | 27 | 50.0 |
| 6 | Beijing | 191 | 42 | 30.07 |
| 7 | Zhejiang | 146 | 11 | 37.5 |
| 8 | Henan | 139 | 16 | -77.4 |
| 9 | Fujian | 70 | 14 | 600 |
| 10 | Shandong | 56 | 7 | 250 |
| Rank from Jan to Sep | Company | Market share from Jan to Sep | Market share in Sep | Rank in Sep |
| 1 | Zoomlion | 31.85 | 27.0 | 2 |
| 2 | Yutong | 30.72 | 35.75 | 1 |
| 3 | Foton | 7.62 | 17.25 | 3 |
| 4 | Fulongma | 6.90 | 6.25 | 4 |
| 5 | Sanli | 3.2 | 2.5 | 5 |
Source : www.chinaspv.com
Editor : Rosy
Views:3209
Share :


Poster

Press to save or share