Recreational vehicle sales decreased by 11% YOY in Sep in China
November 10,2022
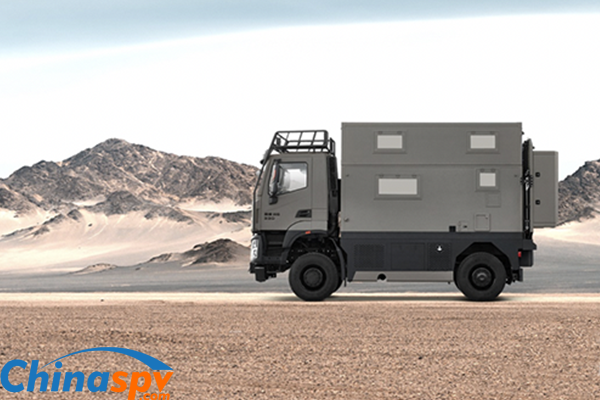
The recreational vehicle (RV) market has developed rapidly in recent years. However, due to the impact of the epidemic, the growth rate of RVs in China has slowed down after the rapid growth in 2021.
 According to the registration data provided by the China Automobile Dealers Association, in September 2022, the actual sales of RVs in China were 1,158 units, a decrease of 10% from the previous month and a decrease of 11% from the same period of last year.
The sales volume of RVs in September was 1,158 units, ranking fourth in the first nine month this year, down 10% month-on-month and 11% year-on-year.
According to the analysis, the main reasons are:
First, the epidemic has been on the rise in various places recently, and the tourism market has been affected.
Second, the end of the summer tourist season in August reduces the demand for RVs.
According to the data of China Automobile Dealers Association, the sales volume and year-on-year statistics of RVs in September and January-September 2022 are as follows:
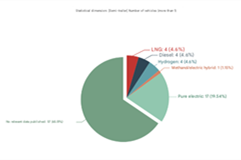
In September and January-September 2022, the sales volume of C-type RVs accounted for 65.9% and 69.6%, respectively, occupying the dominant position in the RV market.
According to the terminal licensing data, the sales ranking of RV companies in September and January-September 2022 are as follows:
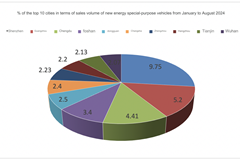
According to the terminal registration information, the top 10 cities for RV sales in September and January-September 2022:
| Jan | Feb | Mar | Apr | May | Jun | Jul | Aug | Sep | |
| Monthly sales in 2022 | 1276 | 380 | 769 | 569 | 843 | 1318 | 1171 | 1292 | 1158 |
| Monthly sales in 2021 | 935 | 411 | 720 | 1266 | 1013 | 1487 | 1429 | 937 | 1302 |
| YOY growth | 36.5 | -7.5 | 6.8 | -55.1 | -16,8 | -11.4 | -18.0 | 38.0 | -11.0 |
| MOM growth | 14.2 | -56.0 | 102.4 | -26.0 | 48.2 | 56.3 | -11.2 | 10.3 | -10.0 |
The sales volume of RVs in September was 1,158 units, ranking fourth in the first nine month this year, down 10% month-on-month and 11% year-on-year.
According to the analysis, the main reasons are:
First, the epidemic has been on the rise in various places recently, and the tourism market has been affected.
Second, the end of the summer tourist season in August reduces the demand for RVs.
According to the data of China Automobile Dealers Association, the sales volume and year-on-year statistics of RVs in September and January-September 2022 are as follows:
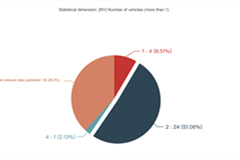
| 2018 | 2019 | 2020 | 2021 | 2022 | |
| Sales in Sep 2022 | 724 | 780 | 1222 | 1302 | 1158 |
| YOY growth in Sep | 51.0 | 8.0 | 57.0 | 7.0 | -11.0 |
| Sales from Jan to Sep 2022 | 5651 | 7154 | 6326 | 9500 | 8776 |
| YOY growth from Jan to Sep | 75.0 | 27.0 | -12.0 | 50.0 | -8.0 |
According to the terminal licensing data, the sales ranking of RV companies in September and January-September 2022 are as follows:
| Rank from Jan to Sep | Company | Sales from Jan to Sep | Sales in Sep | Rank in Sep |
| 1 | SAIC MAXUS | 1153 | 143 | 1 |
| 2 | Yutong | 868 | 124 | 2 |
| 3 | Zhejiang Daide Longcui | 483 | 53 | 4 |
| 4 | Hubei Heli | 443 | 57 | 3 |
| 5 | Hebei Lanzhong SPV | 425 | 45 | 6 |
| 6 | Hubei Qixing | 314 | 44 | 7 |
| 7 | Chery | 306 | 48 | 5 |
| 8 | Hubei Chengli | 230 | 30 | 8 |
| 9 | Henan Xinfei | 181 | 18 | 12 |
| 10 | Shandong KAMA | 171 | 14 | 13 |
| Industry | 8776 | 1158 |
| Rank from Jan to Sep | City | Sales from Jan to Sep | Sales in Sep | Rank in Sep |
| 1 | Suzhou | 345 | 84 | 1 |
| 2 | Beijing | 337 | 48 | 3 |
| 3 | Weihai | 315 | 40 | 6 |
| 4 | Zhengzhou | 285 | 69 | 2 |
| 5 | Changzhou | 273 | 38 | 7 |
| 6 | Yangzhou | 265 | 38 | 7 |
| 7 | Suizhou | 239 | 45 | 5 |
| 8 | Shanghai | 239 | 46 | 4 |
| 9 | Chengdu | 238 | 22 | 12 |
| 10 | Nanjing | 219 | 32 | 9 |
| Total | 8776 | 1158 |
Source : www.chinaspv.com
Editor : Rosy
Views:3543
Share :


Poster

Press to save or share