China’s Concrete Mixer Truck Sales Decreased by 80%YOY in May 2022
July 04,2022
Concrete mixer truck is the largest market segment in the field of construction vehicles. According to statistics from the Auto Thinker, in May 2022, the actual sales of mixer trucks was 2,265 units, a year-on-year decrease of over 80% (-81.9%). From January to May 2022, the actual sales of mixer trucks totaled 12,434 units, a year-on-year decrease of 78.2%.
According to the terminal data from the auto thinker, the sales volume of mixer trucks in the past five years and the year-on-year ratio are as follows:
According to the terminal data from the auto thinker, the sales volume of mixer trucks in the past five years and the year-on-year ratio are as follows:
| 2018 | 2019 | 2020 | 2021 | Jan to May 2022 | |
| Sales (Units) | 66568 | 69641 | 98981 | 98389 | 12434 |
| Year-on-year growth (%) | 45.0 | 4.6 | 42.1 | -0.6 | -78.2 |
From January to May 2022, the sales volume of mixer trucks dropped by 78.2% year-on-year, hitting a record low in the past five years. According to the research analysis, the main reasons are:
First, due to the impact of the epidemic, the economy has been under great downward pressure recently, and many construction projects have been suspended or delayed, resulting in shrinking demand for mixer trucks.
Second, since the beginning of this year, developers' investment in the real estate market has declined seriously, and the demand for mixer trucks has been greatly reduced.
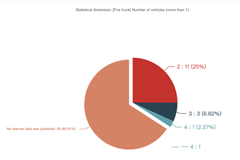
According to the statistics of the terminal registration information: the sales ratio of mixer trucks with different tonnage in the past 5 years is as follows:
First, due to the impact of the epidemic, the economy has been under great downward pressure recently, and many construction projects have been suspended or delayed, resulting in shrinking demand for mixer trucks.
Second, since the beginning of this year, developers' investment in the real estate market has declined seriously, and the demand for mixer trucks has been greatly reduced.
According to the statistics of the terminal registration information: the sales ratio of mixer trucks with different tonnage in the past 5 years is as follows:
| 2018 | 2019 | 2020 | 2021 | Jan to May 2022 | |
| 26-32T Sales (Units) | 62241 | 66507 | 96704 | 98192 | 12384 |
| 26-32T ratio % | 93.5 | 95.5 | 97.7 | 99.8 | 99.6 |
| 19-26T Sales (Units) | 2663 | 2089 | 1287 | 197 | 50 |
| 19-26T ratio % | 4.0 | 3.0 | 1.3 | 0.2 | 0.4 |
| 14-19T Sales (Units) | 1664 | 1045 | 890 | 0 | 0 |
| 14-19T ratio % | 2.5 | 1.5 | 0.9 | 0.0 | 0.0 |
| Total sales (Units) | 66568 | 69641 | 98981 | 98389 | 12434 |
| Total proportion% | 100.0 | 100.0 | 100.0 | 100.0 | 100.0 |
The sales volume of 26T-32T mixer trucks accounted for more than 90% of the total, occupying an absolute dominant position, and the proportion is expected to increase gradually.
The proportion of 19T-26T and 14-19T mixer truck is relatively small, and showed decreasing tendency year by year.
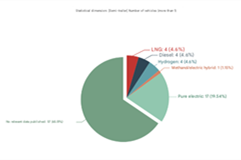
According to the terminal registration data, divided by power type, the sales volume and proportion of mixer trucks in the first five months of 2022 and in recent 5 years:
The proportion of 19T-26T and 14-19T mixer truck is relatively small, and showed decreasing tendency year by year.
According to the terminal registration data, divided by power type, the sales volume and proportion of mixer trucks in the first five months of 2022 and in recent 5 years:
| 2018 | 2019 | 2020 | 2021 | Jan to May 2022 | |
| Sales of diesel trucks (units) | 66235 | 69083 | 98090 | 96421 | 11915 |
| Ratio of diesel trucks% | 99.5 | 99.2 | 99.1 | 98.0 | 95.8 |
| Sales of electric trucks (units) | 0 | 0 | 396 | 1279 | 479 |
| Ratio of electric trucks % | 0.0 | 0.0 | 0.4 | 1.3 | 3.9 |
| Sales of Gas-fueled trucks (units) | 333 | 558 | 495 | 689 | 40 |
| Ratio of Gas-fueled trucks % | 0.5 | 0.8 | 0.5 | 0.7 | 0.3 |
| Total sales (units) | 66568 | 69641 | 98981 | 98389 | 12434 |
| Total proportion % | 100.0 | 100.0 | 100.0 | 100.0 | 100.0 |
The sales of diesel-powered mixer trucks occupy an absolute monopoly position, and in recent years, the proportion has been decreasing year by year;
The proportion of pure electric mixer trucks is increasing year by year;
The cumulative proportion of gas-fueled (mostly LNG) mixer trucks generally shows signs of decreasing, which is mainly related to the instability of gas prices.
According to the terminal registration information, the proportion of the top 10 mixer truck terminal sales in January-May 2022 compared with that in 2021:
| Rank in 2021 | Company | Sales in 2021 (units) | Proportion in 2021 % | Sales from Jan to May 2021 | Proportion from Jan to May 2021 | Rank in Jan to May 2022 |
| 1 | SANY Auto | 21211 | 21.55 | 2599 | 20.9 | 1 |
| 2 | Zoomlion | 10813 | 11.0 | 2358 | 18.96 | 2 |
| 3 | CIMC RJST | 10262 | 10.43 | 1256 | 10.1 | 3 |
| 4 | CIMC Linyu | 9412 | 9.57 | 1181 | 9.50 | 4 |
| 5 | XCMG Schwing | 7863 | 7.99 | 971 | 7.81 | 5 |
| 6 | Tanghong Zhonggong | 6350 | 6.45 | 734 | 5.9 | 7 |
| 7 | CAMA (Anhui Hualing) | 5592 | 5.68 | 758 | 6.1 | 6 |
| 8 | Yate Industry | 5359 | 5.45 | 664 | 5.34 | 8 |
| 9 | CIMC Vehicles | 5105 | 5.19 | 623 | 5.01 | 9 |
| 10 | Sinotruk | 2252 | 2.29 | 379 | 2.50 | 10 |
| TOP10 Total | 84219 | 85.6 | 11274 | 92.1 | ||
| Industry Sales | 98389 | 100.0 | 12434 | 100.0 |
According to the statistics of registration information from all over the country: in the first five months of 2022, the market share of the top 10 mixer trucks in the region compared that with 2021:
| Rank | Regional market | Sales from Jan to May 2022 (units) | Market share from Jan to May 2022 % | Market share in 2021 % |
Share change compared with 2021 |
| 1 | Sichuan | 3890 | 31.2 | 4.72 | 26.49 |
| 2 | Hunan | 3606 | 29.0 | 24.65 | 4.35 |
| 3 | Xinjiang | 763 | 6.1 | 2.80 | 3.30 |
| 4 | Guangdong | 617 | 4.96 | 13.47 | -8.51 |
| 5 | Zhejiang | 508 | 4.09 | 5.1 | -1.01 |
| 6 | Hebei | 452 | 3.64 | 6.06 | -2.42 |
| 7 | Shanxi | 356 | 2.86 | 3.70 | -0.84 |
| 8 | Shandong | 226 | 1.82 | 7.10 | -5.28 |
| 9 | Gansu | 223 | 1.79 | 2.20 | -0.41 |
| 10 | Hubei | 216 | 1.74 | 3.20 | -1.46 |
| 11 | Total | 10857 | 87.2 | 73.0 | 14.2 |
Source : www.chinaspv.com
Editor : Rosy
Views:4333
Share :


Poster

Press to save or share