From January to April, a total of 2,067 New Energy Sanitation Vehicles were Sold
June 17,2024
According to terminal registration data, 590 new energy sanitation vehicles were sold in April 2024, up 16.6% from 506 in March this year, and up 39.81% year-on-year (422 new energy sanitation vehicles were sold in April 2023); 2067 new energy sanitation vehicles were sold in January-April 2024. The cumulative sales (1,703 new energy sanitation vehicles were sold in January-April last year) increased by 21.37% year-on-year, an increase of nearly 6 percentage points from the 15.3% increase in January-March this year, and the positive trend is obvious.
So what are the main characteristics of the new energy sanitation vehicle market in January-April 2024? Here is a brief analysis.
1. April: a year-on-year increase of nearly 40%, a month-on-month increase of 16.6%
According to terminal registration data, 590 new energy sanitation vehicles were sold in April 2024, a month-on-month increase of 16.6% from 506 in March 2024, and a year-on-year increase of nearly 40% (39.81%) from 422 in April 2023. It can be seen that the new energy sanitation vehicle market in April 2024 has achieved a good development trend of both year-on-year and month-on-month growth.
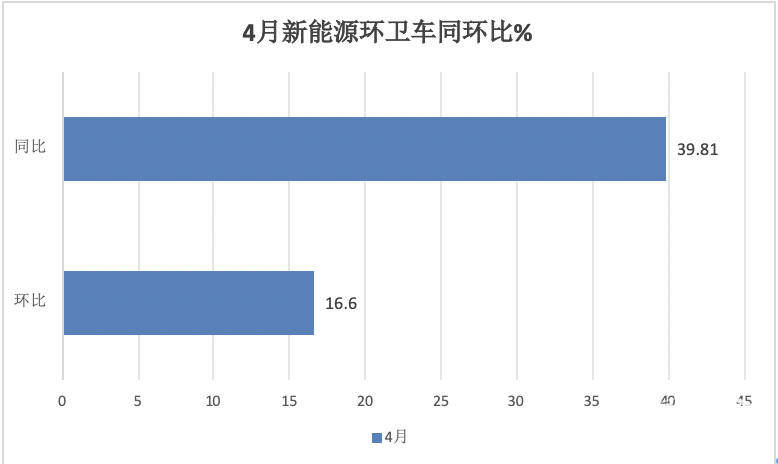
---In April 2024, new energy sanitation vehicles increased by 39.81% year-on-year. According to analysis, this was mainly due to the low sales base in the same period of 2023 (422 vehicles), which provided support for the year-on-year growth in April this year;
---In April 2024, new energy sanitation vehicles increased by 16.6% month-on-month. According to analysis, the main reasons are:
First, the sales volume of new energy sanitation vehicles in March 2024 was relatively high (506 vehicles), which brought certain pressure to the month-on-month surge in April this year, thus showing a development trend of 590 vehicles with a month-on-month growth of 16.6%.
2. Sales volume in each month from January to April increased year-on-year for 4 consecutive years, and sales volume in April reached a new high for each month
Table 2, based on terminal registration data, sales volume and year-on-year growth of new energy sanitation vehicles in each month from January to April 2024:

The above table shows the sales volume and year-on-year growth of new energy sanitation vehicles in each month from January to April 2024:
----The sales volume of each month showed a "four consecutive increases" year-on-year, among which the sales volume in February increased by 51.2% year-on-year, leading the growth of all months;
---The sales volume in April was 590 vehicles, which, together with the sales volume in January this year, created a new high for the sales volume in each month from January to April this year.
3. The first four months outperformed the overall market of sanitation vehicles year-on-year
Table 2, based on the terminal registration data, the year-on-year comparison of new energy sanitation vehicles and the overall market of sanitation vehicles from January to April 2024:

As shown in the table above:
--- From January to April this year, the cumulative year-on-year growth of new energy sanitation vehicles was 21.37%, outperforming the growth rate of the sanitation vehicle market of -5.77% from January to April this year by nearly 27.14 percentage points, becoming a highlight of the sanitation vehicle market. According to analysis:
First, the national policy empowerment.
Since the beginning of this year, the state has intensively issued various policies to promote the development of new energy vehicles in public areas such as sanitation, which has greatly promoted the growth of the new energy sanitation vehicle market from January to April this year;
Second, fiscal and economic deficits appeared in many places, reducing the purchase plan of traditional sanitation vehicles.
Due to the economic environment in the first quarter of this year, fiscal deficits appeared in many places across the country. In order to compress the development, some places reduced the purchase plan of sanitation vehicles funded by local finances.
Third, the sales base of new energy sanitation vehicles in the same period last year was not large, which provided opportunities for the year-on-year growth of new energy sanitation vehicles from January to April this year.
4. Growth started in June last year, and as of April this year, it has increased for 11 consecutive times
Table 3, based on terminal registration data, monthly sales of new energy sanitation vehicles and year-on-year growth from January 2023 to the first four months of 2024:

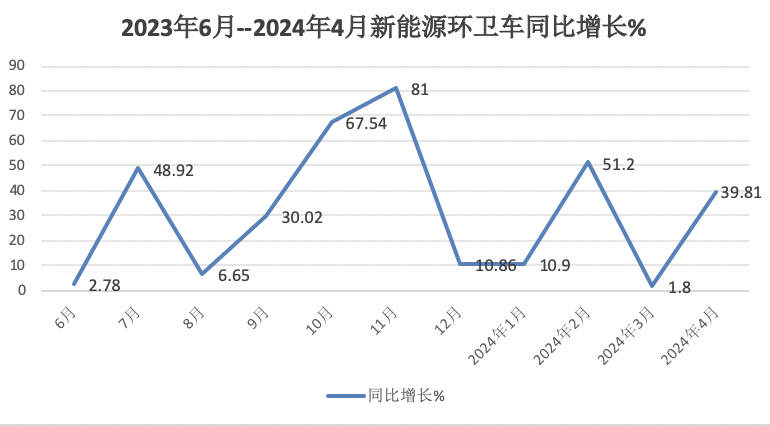
The above chart shows the sales volume and year-on-year growth of new energy sanitation vehicles in each month from January 2023 to April 2024:
---- In April this year, sales increased by 39.81% year-on-year, from the "10 consecutive increases" in June, July, August, September, October, November, December last year, January, February and March this year to "11 consecutive increases". Growth has become the "main tone" of the new energy sanitation vehicle market in the past 16 months since 2023. The main reason is that the sales base was low due to the impact of the epidemic during the same period, and the other is the recent policy support for the development of new energy vehicles.
5. The market penetration rate of new energy sanitation vehicles in the first four months increased by 1.88 percentage points year-on-year
According to terminal registration data, a total of 2,067 new energy sanitation vehicles were sold from January to April 2024; and the overall sales volume of sanitation vehicles from January to April 2024 was 24,583 vehicles. Therefore, the market penetration rate of new energy sanitation vehicles from January to April 2024 was 8.41%, an increase of 1.88 percentage points from the penetration rate of 6.53% in the same period last year.
Table 4, Penetration rate and year-on-year change of new energy sanitation vehicles from January to April 2024 (data source: terminal registration)

According to the survey and analysis, it is mainly due to the continuous efforts of the "dual carbon" strategy and the continuous empowerment of policies.
First, the continuous efforts of the dual carbon strategy have led to a year-on-year increase in new energy sanitation vehicles from January to April this year (21.37%), while the overall market of sanitation vehicles from January to April this year has declined (-5.77%). This "one increase and one decrease" has increased the market penetration rate of new energy sanitation vehicles from January to April this year;
Second, it is due to the recent introduction of various policies by the state and various regions to encourage and support the acceleration of public-sector electrification of vehicles including sanitation vehicles. For example, Hainan Province requires that the proportion of new replacements and use of clean energy in the public service sector and social operation sector reach 100% by 2025, and Henan Province requires that all new buses and municipal sanitation vehicles use new energy vehicles. These policies have undoubtedly accelerated the electrification process of the sanitation vehicle market from January to April this year.
VI. Cumulative sales in the first four months: pure electric vehicles lead the way
Table 5, based on terminal registration data, divided by technical routes, sales share and year-on-year increase and decrease of various types of new energy sanitation vehicles from January to April 2024:

The table above shows that in the year-on-year sales of new energy sanitation vehicles of various technical routes from January to April 2024:
--A total of 1,850 pure electric sanitation vehicles were sold, accounting for 89.5% of the market, leading the new energy sanitation vehicle market, and the proportion increased by 3 percentage points year-on-year, leading the segment with the largest year-on-year increase in proportion;
--A total of 166 hybrid models were sold, accounting for 8.03% of the market, ranking second, and the proportion decreased by 3.97 percentage points year-on-year, which was the segment with the largest year-on-year decrease in proportion;
--A total of 51 fuel cell sanitation vehicles were sold, accounting for 2.47% of the market, ranking third, and the proportion increased by 0.97 percentage points year-on-year, which was the segment with the second largest year-on-year increase in proportion;
In short, "pure electric leading the way" is a detailed feature of the new energy sanitation vehicle market from January to April 2024.
VII. Cumulative sales from January to April: Yingfeng Environment, Yutong Heavy Industry, and XCMG Automobile ranked the top three; Foton led the rise
Table 6, based on terminal registration data, in the market competition landscape of new energy sanitation vehicles from January to April 2024:
As can be seen from the above table, the competition landscape of major new energy sanitation vehicle companies from January to April 2024:
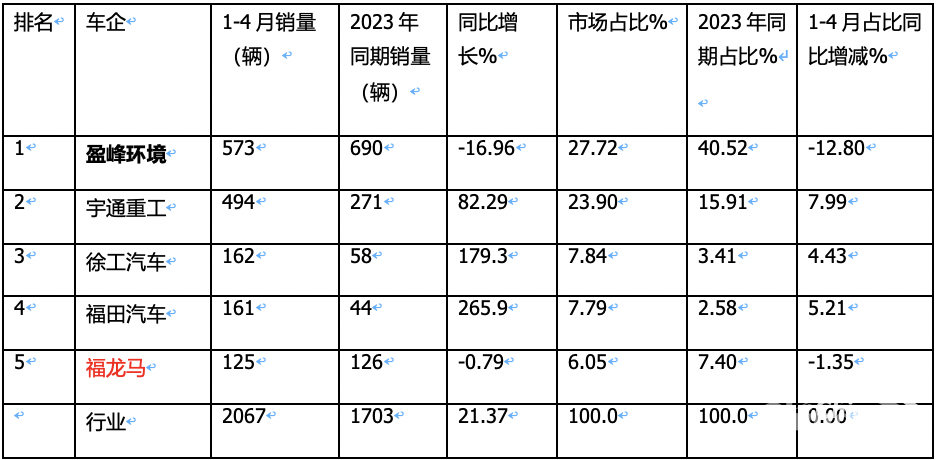
---Yingfeng Environment sold 573 vehicles in total, down 16.96% year-on-year, with a market share of 27.72%, ranking first; and its share decreased by 12.8 percentage points year-on-year; it was the car company with the largest year-on-year decrease in share in the industry;
---Yutong Heavy Industry sold 494 vehicles in total, ranking second in the industry, up 82.29% year-on-year, outperforming the market, The market share is 23.9%, an increase of 7.99 percentage points year-on-year, and it is the automaker with the largest year-on-year increase in market share in the industry; the performance is eye-catching;
---XCMG Automobile has sold a total of 162 vehicles, ranking third, up 179.3% year-on-year, outperforming the market, with a market share of 7.84%, an increase of 4.43 percentage points year-on-year;
---Foton Motor has sold a total of 161 vehicles, ranking fourth, up 265.9% year-on-year, outperforming the market, with a market share of 7.79%, an increase of 5.21 percentage points year-on-year
----Fulongma has sold a total of 125 vehicles, ranking fifth, down 0.79% year-on-year, outperforming the market; the market share is 6.05%; and the proportion has decreased by 1.35 percentage points year-on-year.
So what are the main characteristics of the new energy sanitation vehicle market in January-April 2024? Here is a brief analysis.
1. April: a year-on-year increase of nearly 40%, a month-on-month increase of 16.6%
According to terminal registration data, 590 new energy sanitation vehicles were sold in April 2024, a month-on-month increase of 16.6% from 506 in March 2024, and a year-on-year increase of nearly 40% (39.81%) from 422 in April 2023. It can be seen that the new energy sanitation vehicle market in April 2024 has achieved a good development trend of both year-on-year and month-on-month growth.

---In April 2024, new energy sanitation vehicles increased by 39.81% year-on-year. According to analysis, this was mainly due to the low sales base in the same period of 2023 (422 vehicles), which provided support for the year-on-year growth in April this year;
---In April 2024, new energy sanitation vehicles increased by 16.6% month-on-month. According to analysis, the main reasons are:
First, the sales volume of new energy sanitation vehicles in March 2024 was relatively high (506 vehicles), which brought certain pressure to the month-on-month surge in April this year, thus showing a development trend of 590 vehicles with a month-on-month growth of 16.6%.
2. Sales volume in each month from January to April increased year-on-year for 4 consecutive years, and sales volume in April reached a new high for each month
Table 2, based on terminal registration data, sales volume and year-on-year growth of new energy sanitation vehicles in each month from January to April 2024:

The above table shows the sales volume and year-on-year growth of new energy sanitation vehicles in each month from January to April 2024:
----The sales volume of each month showed a "four consecutive increases" year-on-year, among which the sales volume in February increased by 51.2% year-on-year, leading the growth of all months;
---The sales volume in April was 590 vehicles, which, together with the sales volume in January this year, created a new high for the sales volume in each month from January to April this year.
3. The first four months outperformed the overall market of sanitation vehicles year-on-year
Table 2, based on the terminal registration data, the year-on-year comparison of new energy sanitation vehicles and the overall market of sanitation vehicles from January to April 2024:

As shown in the table above:
--- From January to April this year, the cumulative year-on-year growth of new energy sanitation vehicles was 21.37%, outperforming the growth rate of the sanitation vehicle market of -5.77% from January to April this year by nearly 27.14 percentage points, becoming a highlight of the sanitation vehicle market. According to analysis:
First, the national policy empowerment.
Since the beginning of this year, the state has intensively issued various policies to promote the development of new energy vehicles in public areas such as sanitation, which has greatly promoted the growth of the new energy sanitation vehicle market from January to April this year;
Second, fiscal and economic deficits appeared in many places, reducing the purchase plan of traditional sanitation vehicles.
Due to the economic environment in the first quarter of this year, fiscal deficits appeared in many places across the country. In order to compress the development, some places reduced the purchase plan of sanitation vehicles funded by local finances.
Third, the sales base of new energy sanitation vehicles in the same period last year was not large, which provided opportunities for the year-on-year growth of new energy sanitation vehicles from January to April this year.
4. Growth started in June last year, and as of April this year, it has increased for 11 consecutive times
Table 3, based on terminal registration data, monthly sales of new energy sanitation vehicles and year-on-year growth from January 2023 to the first four months of 2024:


The above chart shows the sales volume and year-on-year growth of new energy sanitation vehicles in each month from January 2023 to April 2024:
---- In April this year, sales increased by 39.81% year-on-year, from the "10 consecutive increases" in June, July, August, September, October, November, December last year, January, February and March this year to "11 consecutive increases". Growth has become the "main tone" of the new energy sanitation vehicle market in the past 16 months since 2023. The main reason is that the sales base was low due to the impact of the epidemic during the same period, and the other is the recent policy support for the development of new energy vehicles.
5. The market penetration rate of new energy sanitation vehicles in the first four months increased by 1.88 percentage points year-on-year
According to terminal registration data, a total of 2,067 new energy sanitation vehicles were sold from January to April 2024; and the overall sales volume of sanitation vehicles from January to April 2024 was 24,583 vehicles. Therefore, the market penetration rate of new energy sanitation vehicles from January to April 2024 was 8.41%, an increase of 1.88 percentage points from the penetration rate of 6.53% in the same period last year.
Table 4, Penetration rate and year-on-year change of new energy sanitation vehicles from January to April 2024 (data source: terminal registration)

According to the survey and analysis, it is mainly due to the continuous efforts of the "dual carbon" strategy and the continuous empowerment of policies.
First, the continuous efforts of the dual carbon strategy have led to a year-on-year increase in new energy sanitation vehicles from January to April this year (21.37%), while the overall market of sanitation vehicles from January to April this year has declined (-5.77%). This "one increase and one decrease" has increased the market penetration rate of new energy sanitation vehicles from January to April this year;
Second, it is due to the recent introduction of various policies by the state and various regions to encourage and support the acceleration of public-sector electrification of vehicles including sanitation vehicles. For example, Hainan Province requires that the proportion of new replacements and use of clean energy in the public service sector and social operation sector reach 100% by 2025, and Henan Province requires that all new buses and municipal sanitation vehicles use new energy vehicles. These policies have undoubtedly accelerated the electrification process of the sanitation vehicle market from January to April this year.
VI. Cumulative sales in the first four months: pure electric vehicles lead the way
Table 5, based on terminal registration data, divided by technical routes, sales share and year-on-year increase and decrease of various types of new energy sanitation vehicles from January to April 2024:

The table above shows that in the year-on-year sales of new energy sanitation vehicles of various technical routes from January to April 2024:
--A total of 1,850 pure electric sanitation vehicles were sold, accounting for 89.5% of the market, leading the new energy sanitation vehicle market, and the proportion increased by 3 percentage points year-on-year, leading the segment with the largest year-on-year increase in proportion;
--A total of 166 hybrid models were sold, accounting for 8.03% of the market, ranking second, and the proportion decreased by 3.97 percentage points year-on-year, which was the segment with the largest year-on-year decrease in proportion;
--A total of 51 fuel cell sanitation vehicles were sold, accounting for 2.47% of the market, ranking third, and the proportion increased by 0.97 percentage points year-on-year, which was the segment with the second largest year-on-year increase in proportion;
In short, "pure electric leading the way" is a detailed feature of the new energy sanitation vehicle market from January to April 2024.
VII. Cumulative sales from January to April: Yingfeng Environment, Yutong Heavy Industry, and XCMG Automobile ranked the top three; Foton led the rise
Table 6, based on terminal registration data, in the market competition landscape of new energy sanitation vehicles from January to April 2024:
As can be seen from the above table, the competition landscape of major new energy sanitation vehicle companies from January to April 2024:

---Yingfeng Environment sold 573 vehicles in total, down 16.96% year-on-year, with a market share of 27.72%, ranking first; and its share decreased by 12.8 percentage points year-on-year; it was the car company with the largest year-on-year decrease in share in the industry;
---Yutong Heavy Industry sold 494 vehicles in total, ranking second in the industry, up 82.29% year-on-year, outperforming the market, The market share is 23.9%, an increase of 7.99 percentage points year-on-year, and it is the automaker with the largest year-on-year increase in market share in the industry; the performance is eye-catching;
---XCMG Automobile has sold a total of 162 vehicles, ranking third, up 179.3% year-on-year, outperforming the market, with a market share of 7.84%, an increase of 4.43 percentage points year-on-year;
---Foton Motor has sold a total of 161 vehicles, ranking fourth, up 265.9% year-on-year, outperforming the market, with a market share of 7.79%, an increase of 5.21 percentage points year-on-year
----Fulongma has sold a total of 125 vehicles, ranking fifth, down 0.79% year-on-year, outperforming the market; the market share is 6.05%; and the proportion has decreased by 1.35 percentage points year-on-year.
Source : www.chinaspv.com
Editor : Sissi
Views:3035


